from sklearn.datasets import make_blobs

from sklearn import decomposition

from sklearn.decomposition import PCA

from sklearn.cluster import KMeans

from sklearn.preprocessing import StandardScaler
*군집분석이란?
변수들이 속한 모집단 or 범주에 대한 사전정보가 없는 경우
==>
1. 관측값 사이의 거리(유사도) euclidean
2. 유사성을 이용하여 개체들을 몇개의 그룹으로 나눈다
3. 군집으로 나누는 분석법 KMean
Clustering(= 데이터의 연관된 feature를 바탕으로 유사한 그룹생성)
*목적
Clustering이 대답할수 있는 질문은 주어진 데이터들이 얼마나, 어떻게 유사한지
주어진 데이터셋을 요약/정리하는데 있어서 매우 효율적인 방법들중 하나로 사용
== but, 정답을 보장하지 않는다는 이슈가 있어서 예측을 위한 모델링에 쓰이기 보다는
EDA를 위한 방법으로써 많이 쓰임
*지도 학습 (Supervised Learning): Supervised Learning은 트레이닝 데이터에 라벨(답)이 있을때 사용
분류 (Classification) 분류 알고리즘은 주어진 데이터의 카테고리 혹은 클래스 예측을 위해 사용
회귀 (Prediction) 회귀 알고리즘은 continuous 한 데이터를 바탕으로 결과를 예측 하기 위해 사용
*비지도학습(= UnSupervised Learning)
-비지도학습= 클러스터링 (Clustering) 데이터의 연관된 feature를 바탕으로 유사한 그룹을 생성
==> '얼마나 어떻게 유사한지 판별'
Clustering의종류
Hierarchical 계층적 군집 분석
- Agglomerative: 개별 포인트에서 시작후 점점 크게 합쳐감
- Divisive: 한개의 큰 cluster에서 시작후 점점 작은 cluster로 나눠감
Point Assignment 비계층적 군집분석
- 시작시에 cluster의 수를 정한 다음, 데이터들을 하나씩 cluster에 배정시킴
- 다변량 자료의 산포를 나타내는 여러측도를 이용하여 판정기준을 최적화시키는 방법
Hard vs Soft Clustering
Hard Clustering에서 데이터는 하나의 cluster에만 할당
Soft Clustering에서 데이터는 여러 cluster에 확률을 가지고 할당
일반적으로 Hard Clustering을 Clustering이라 칭한다.
ML
데이터 특징 : 답이 있다, 없다 (input)
목적 : 회귀, 분류(output)
*회귀= continous한 데이터를 바탕으로
*분류= 데이터 카테고리 or 클래스 예측

*Euclidean
== 유사도(관측값사이거리)
x = np.array([1, 2, 3])
y = np.array([1, 3, 5])
dist = np.linalg.norm(x-y)
== 거리가 크면 유사도는 낮고
(= 비유사도 크다)
과정
1) k 개의 랜덤한 데이터를 cluster의 중심점으로 설정
2) 해당 cluster에 근접해 있는 데이터를 cluster로 할당
3) 변경된 cluster에 대해서 중심점을 새로 계산(centroid)
cluster에 유의미한 변화가 없을 때 까지 2-3을 반복
- Distance Measure 결정= 유클리드
- Clustering 알고리즘 결정(= cluster 간거리 ward, complete, average...)
- * k개 군집수 사전 결정
- *군집의 초기값을 이용하거나 초기분할에 의해 결정된 초기 군집에 개체를 할당
단점
- K개수 결정이 주관적
- 아웃라이어가 있을 경우 적어도 한 군집은 거리가 멀어도 해당값을 한군집으로 묶음
- 군집의 size나 모양이 다를 경우 애매한 결과 나올 수 있음
* 군집화 => PCA
## cluster 시각화
def get_centroids(df, column_header):
     new_centroids = df.groupby(column_header).mean() # Kmean Cluster 평균
     return new_centroids


def plot_clusters(df, column_header, centroids):
  colors = {0 : 'red', 1 : 'cyan', 2 : 'yellow'}

  fig, ax = plt.subplots()
  ax.plot(centroids.iloc[0].x, centroids.iloc[0].y, "ok") # 기존 중심점
  ax.plot(centroids.iloc[1].x, centroids.iloc[1].y, "ok")
  ax.plot(centroids.iloc[2].x, centroids.iloc[2].y, "ok")
  grouped = df.groupby(column_header)

  for key, group in grouped:
      group.plot(ax = ax, kind = 'scatter', x = 'x', y = 'y', label = key, color = colors[key])

  plt.show()


from sklearn.cluster import KMeans
from sklearn.preprocessing import StandardScaler

## 1. 군집화할 Feature 선택
ddf = df[["", "", ....]]

## 2. 각 Feature의 값이 차이가 심하다면 표준화 진행
## 표준화 = Feature가 정규분포를 따를때 유용
sc = StadardScaler()
ddf_sc = sc.fit_transform(ddf)

## 3. cluster Feature 생성
kmeans = KMeans(n_clusters = 3)
kmeans.fit(ddf_sc)
ddf["cluster"] = kmeans.labels_

'''
## 4. Data EDA 및 시각화
centroids = get_centroids(df, 'clusters')
plot_clusters(df, 'clusters', centroids)
'''

## 5. 만약 차원수가 많다면 PCA 진행, 2차원
copy_val = ddf_sc.copy()
pca = PCA(n_compoents=2) # 차원 수
pca.fit(copy_val)

'''
# pca.components == 고유벡터
print("\n Eigenvectors: \n", pca.components_)

# 주성분 비율
ratio= pca.explained_variance_ratio_

# ratio 합이 88%이상 or
# scree plot으로 확인
fig, ax= plt.subplots(figsize=(10,8))

plt.plot(ratio, 'o-')
'''

## transform
pca_val = pca.transform(copy_val)

## 6. pca DataFrame 생성 및 cluster Feature 적용
pca_df = pd.DataFrame(pca_val)
pca_df["cluster"] = ddf["cluster"]

## 7. 시각화
import seaborn as sns
axs = plt.subplots()
axs = sns.scatterplot(0, 1, hue='cluster', data=pca_df)
Initial Centroid state
k-means는 centroid를 어떻게 선택하느냐에 따라서, clustering의 결과가 안 좋거나 끝없이 반복해야
하는 경우도 있습니다.
군집 간 거리 측정 방식
- centroid : (두 군집의 중심점을 정의한) 다음 두 중심점의 거리를 군집간의 거리로 측정
- single : 두 군집에 있는 모든 데이터 조합에서 데이터 사이거리 측정 ==> 가장 최소 거리를 기준으로 군집거리 측정
- complete : 두 군집에서 가장 먼 거리를 이용해서 측정
- average : 평균 연결법 = 군집간 거리를 데이터 간 모든 거리들의 평균
- ward : 군집내 편차들의 제곱합을 기준으로 최소 제곱합을 가지게 되는 군집끼리 연결
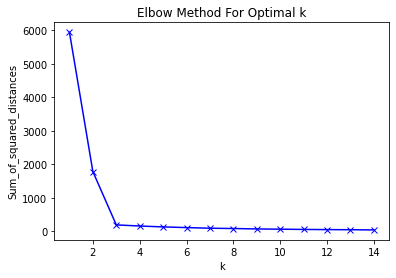
*군집개수 결정방법
- dendrogram
- Elbow Method
km_list=[]
k= range(1,10)

for i in k:
  km= KMeans(n_clusters=i)
  km= km.fit(features)
  km_list.append(km.inertia_)


plt.plot(km_list, 'o-')
plt.legend(bbox_to_anchor=(1, 1)) ==> label 바깥으로
from yellowbrick.cluster import KElbowVisualizer
from yellowbrick.classifier import ROCAUC


#ROCAUC 사용 가능
visualizer = ROCAUC(xgb_basic, classes=[0, 1], micro=False, macro=True, per_class=False)

visualizer.fit(X_train, df["y"])
visualizer.score(X_train, df["y"])


#KElbowVisualizer
model = KMeans()

visualizer = KElbowVisualizer(model, k=(1,10))
visualizer.fit(x.reshape(-1,1))
https://tariat.tistory.com/819
K-means 클러스트링 군집 갯수 정하는 방법은?!
알고리즘은 숫자를 가지고 계산되지만, 이를 위해서는 사람이 결정하고 입력해줘야 하는 값들이 있다. 이 중에는 애매한 값들을 사람이 입력해줘야 하는 경우도 있다. KMeans 클러스트링 알고리
tariat.tistory.com
녹색 : 군집을 학습할 때 걸린 시간
파랑색 : 그룹의 변동성을 확인하는 지표
군집의 갯수가 2개일 때 3개보다 더 시간이 오래 걸린다. 자세한 방법은 알 수 없지만,
클러스트링이 잘 될 때 학습 시간도 적게 걸리는 듯 하다.
'Data Analysis, DA > Linear Algebra' 카테고리의 다른 글
| Log Transform (0) | 2023.05.31 |
|---|---|
| n133 eigenvalue/eigenvector 주성분분석(PCA) (0) | 2021.05.27 |
| n132 공분산과 상관계수 cov, corr/ vector (0) | 2021.05.27 |
| n131 벡터와 행렬(vector and matrices)/ 선형대수 (0) | 2021.05.22 |


댓글